An Update of our Cryptoasset Valuation Frameworks and Portfolio Allocation Strategies: Q2 2023

%20(1).webp)
Link to our State of Crypto on Portfolio Allocation: https://21shares.com/research/state-of-crypto-6
Link to our State of Crypto on Valuation Frameworks: https://21shares.com/research/state-of-crypto-7
Link to all of our on-chain dashboards: https://dune.com/21co
TL;DR
- Valuation methodologies: There are two broad types of valuation approaches: (1) Fundamental or Intrinsic valuation composed of the Discounted Cash Flow (DCF) method and Mining Production Cost. (2) Relative valuation composed of Multiples and Market Sizing.
- Valuation methods depend on the type of cryptoassets: Both fundamental and relative valuations can be applied to all cryptoassets but should differ and adapt to the type of consensus mechanism: Proof-of-Work (like Bitcoin) versus Proof-of-Stake (like Ethereum).
- Bitcoin valuation: We estimate the floor price of Bitcoin using the Mining Production Cost. In addition, we use relative approaches like market sizing and multiples to value Bitcoin.
- Ethereum valuation: We value Ethereum using an intrinsic valuation computed with a discounted cash flow (DCF) method.
- Challenges relative to cryptoasset valuations: We aim to provide investors with the right tools to value this asset class, as there is no objective measure of value for cryptoassets today. However, it’s worth remembering that the more uncomfortable an investor feels when valuing an asset, the greater the payoff of doing the valuation.
- Portfolio allocation: Adding Bitcoin to an investor’s portfolio may provide diversification benefits due to its low historical correlation to other asset classes. In our backtest, a 5% BTC allocation improved overall performance across all rebalance frequencies, improving annualized returns and enhancing the Sharpe ratio. In addition, a 1% BTC allocation decreased the annualized volatility of the portfolio.

Background
In 2022, we published two groundbreaking reports on our insights into cryptoasset portfolio allocation and valuation frameworks. In June, our State of Crypto Issue 6 provided data on optimizing crypto portfolio allocation for various risk profiles and portfolio strategies based on on-chain indicators. In October, Issue 7 provided our insights into fundamental and relative valuation frameworks for each type of cryptoasset. Every quarter, we will present an updated report with our latest valuation estimates and portfolio allocation figures. However, before diving into the data, why are these topics important?
- Valuation in crypto remains an emerging topic seeking consensus, especially as the asset class expands in use cases. Robert Greer, author of “What is an asset class anyway?” argues that assets that lack an objective measure of value and have a constraint on supply are more vulnerable to irrational exuberance, citing the dot-com bubble as an example. Cryptoassets lack an objective measure of value today among investors, similar to emerging tech companies in the late 1990s. Our goal is to propose valuation methodologies that reconcile different approaches investors have taken in recent years.
- Optimal cryptoasset portfolio allocation can lead to superior risk-adjusted investment returns due to their unique property of having largely unrelated risk premiums compared to all other asset classes. Rebalance is critical for portfolio construction to smooth out those big swings across major asset classes, especially for cryptoassets, including Bitcoin and Ethereum, and harvest the long-term premium with diversification benefits. With this in mind, it seems reasonable to explore the performance of adding cryptoassets to portfolios with different rebalance frequencies.
Coverage
- Fundamental valuation: Ethereum DCF and Bitcoin mining cost of production.
- Relative valuation: NVT, market cap-to-Thermocap, market sizing.
- Portfolio allocation: correlation matrix and different rebalancing frequencies with 5% and 1% BTC allocation.
- Conclusion
Fundamental Valuation
- From the standpoint of a validator, PoS cryptoassets like Ethereum are akin to a stock that pays an annual dividend yield (the "staking yield") in return for securing the network and validating on-chain activity.
- In practice, the marginal cost of production is vital for crypto-commodities (PoW cryptoassets like Bitcoin), as it sets the price floor at which producers (miners) are willing to sell.
DCF Valuation: Ethereum
1 . Estimate the cash flows during the life of the cryptoasset
- a. Transaction fees perceived by validators (after the burn mechanism) from Sep 15, 2022 (The Merge) to June 30, 2023, amounted to $274.96 million, which translates to annualized fees of $348.48 million.
- b. Token Issuance from Sep 15, 2022, to June 30, 2023, amounted to $852.17 million, which translates to annualized issuance of $1.08 billion.
- c. Total Cash Flows: a + b = $1.43 billion in the first year.
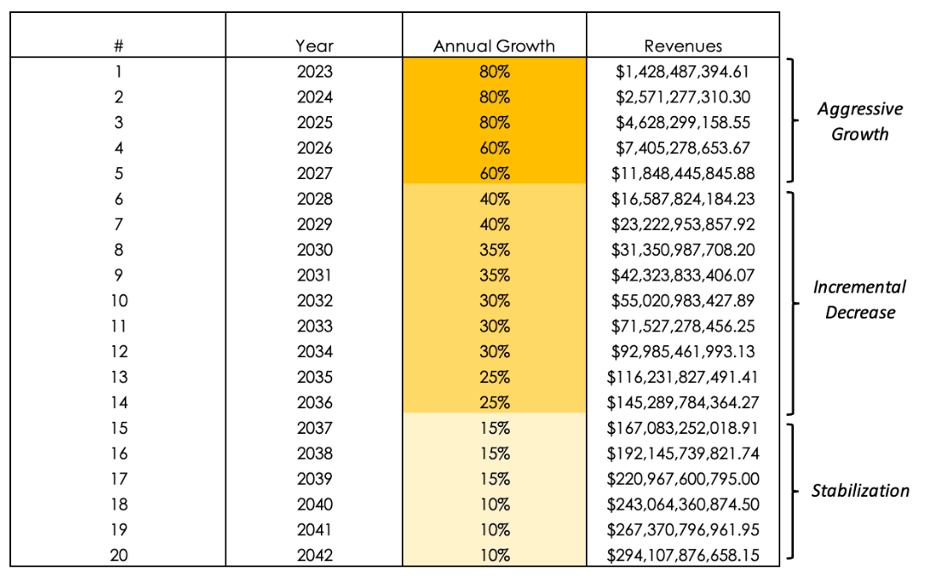
2. Estimate expected future cash flows and the lifespan of the cryptoasset. We proposed a three-stage growth model:
Figure 1: Ethereum three-stage growth model
Source: 21Shares
3. Estimate the discount rate to apply to these cash flows to get Net Present Value (NPV).
- Lower-bound discount rate (13%): In the last 30 years, the Invesco QQQ Trust ETF obtained a 13.03% compound annual return.
- Higher-bound discount rate (19.19%): Obtained using the Fama and French Three-Factor Model (market premium, size premium, and value premium).
Figure 2: Ethereum DCF valuation

Source: 21Shares
- Results: Assuming a discount rate of 13%, the implied price per one ETH today would be ~$2,725, a 41% increase from ETH’s current price ($1,934). On the other hand, if we use a 19.19% discount rate, the implied price per one ETH would be **$1,349**. Investors should interpret the results of this DCF valuation with caution and run their own assumptions regarding projected cash flows and discount rates. The rationale behind our approach was to be conservative and capture the high volatility of ETH in the discount rate to reflect the asset’s riskiness accurately. Another implicit assumption of this approach is that the asset’s monetary premium (Store of Value) is embedded into the DCF.
Mining cost of production
- In 2019, Charles Edwards proposed a methodology to estimate the global average US dollar cost of producing one BTC.
- The marginal cost of production is a tool that can help investors estimate a lower bound price level for BTC and other crypto-commodities.
- When the BTC price is below the total cost of mining one BTC, it signals that Bitcoin miners may be struggling and potentially taking short-term losses.
- Since we published our update on valuation frameworks in Q1 2023, the average electricity cost to mine one BTC has increased 9.42% from ~$19,160 in March 2023 to ~$20,965 as of June 30, 2023, according to the Cambridge Bitcoin Electricity Consumption Index (CBECI).
Figure 3: Bitcoin mining cost of production
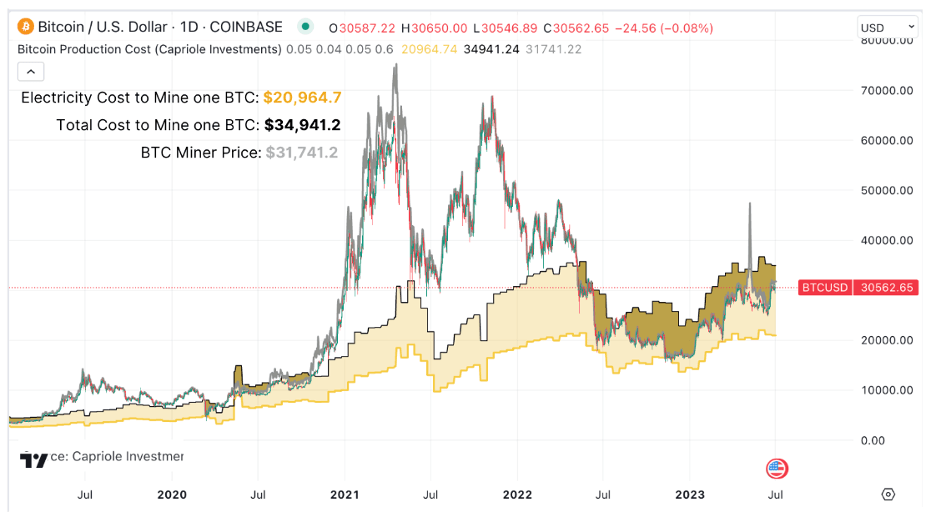
Source: 21Shares, data as of June 30, 2023
- Results: As of June 30, 2023, the estimated global average electricity cost to mine one BTC is $20,964.7, while the estimated global average total cost to mine one BTC is $34,941.2. Investors shouldn’t interpret this range as the fundamental value of Bitcoin, which is subjective, but rather as an estimate of its price floor based on miner profitability and subsequent behavior patterns.
Relative valuation (Pricing)
- A significant portion of equity valuations in traditional finance consists of relative valuations based on multiples and comparables.
- In this section, we will explore two “multiples”: the Network-Value-to-Transaction (NVT) Ratio and the Market Cap to Thermocap Ratio.
Figure 4: Relative valuation based upon multiples

Source: 21Shares
Network-Value-to-Transactions (NVT) Ratio
- The Network-Value-to-Transactions (NVT) Ratio measures the dollar value of on-chain transaction activity of a given protocol relative to its Network Value.
- Per Glassnode, NVT can be interpreted as the inverse of monetary velocity, comparing Bitcoin’s two primary value propositions: Store of Value (Market Cap) and Settlement/Payments Network (Transfer Volume).
- The results suggest that investors are currently pricing BTC at a premium, as market cap growth is outpacing on-chain transaction volume relative to historical levels. A plausible interpretation is that the Store of Value component of BTC predominates in recent times over BTC’s value proposition as a payment network.
Figure 5: Bitcoin’s NVT-based implied price
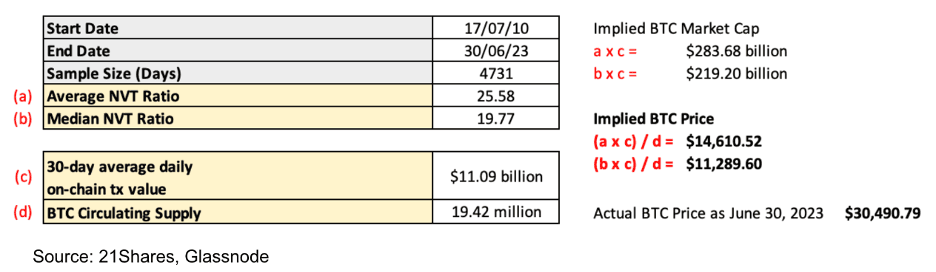
Source: 21Shares, Glassnode
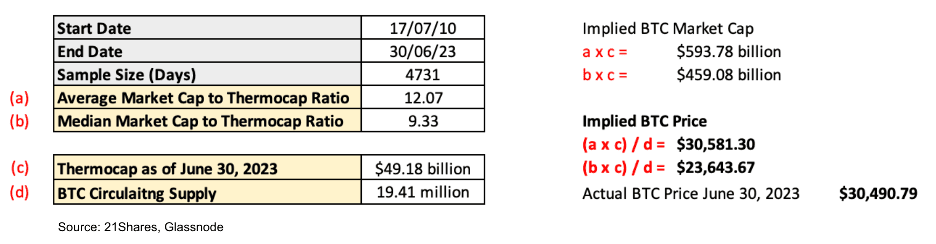
Market Cap to Thermocap Ratio
- “Thermocap” is the cumulative sum of USD block rewards paid to miners. It can be interpreted as the total security spent by miners. Figure 6 shows that a high market cap compared to total aggregate security spent has historically been an indicator that BTC is relatively overvalued and near the top of a market cycle. Conversely, a low market cap to Thermocap ratio has historically signaled that BTC is relatively undervalued and near the bottom of a cycle.
Figure 6: Market Cap to Thermocap Ratio (July 2010 - June 2023)
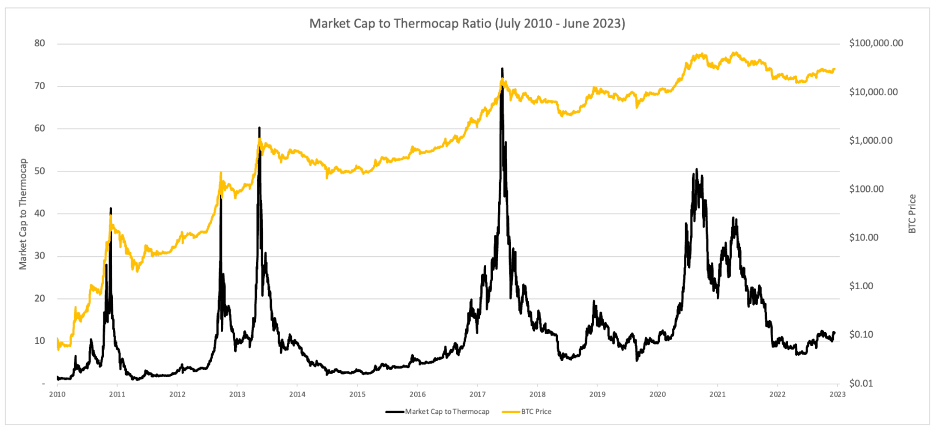
Source: 21Shares, Glassnode
- Results: Investors can use the market cap to Thermocap ratio to assess if the asset’s price is currently trading at a premium to the total security spent by miners. Bitcoin is currently trading within its “fair value” compared to the historical market cap to Thermocal ratio.
Figure 7: Bitcoin’s implied price range based on Market Cap to Thermocap
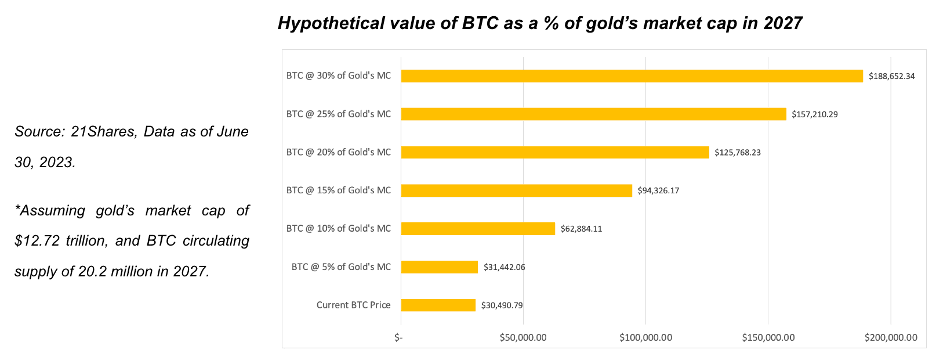
Market Sizing
- Investors cannot value store-of-value assets intrinsically because their value is primarily determined by the subjective beliefs of many individuals. Thus, we can utilize a simple market sizing approach to estimate a target price. The methodology involves establishing a Total Addressable Market (TAM), and a percent share the asset in question could take — Market Penetration. For instance, an investor could price Bitcoin by setting a proportion it could capture of the market value of gold, the seminal store-of-value asset.
- Results: As of June 30, the price of BTC is $30,491, with an implied circulating market cap of ~$592 billion. On the other hand, the market cap of gold sits at around $12.72 trillion. Thus, we can use the market sizing methodology described above to estimate the hypothetical price of BTC if it were to capture a given percent share of gold’s market cap. For instance, Figure 8 shows that if BTC were to capture 10%, it would be priced at $62,884.11. In the most optimistic scenario contemplated, if BTC penetrates 30% of gold’s market cap, the price of one BTC would be $188,652.34.
Figure 8: Hypothetical value of BTC as a % of gold’s market cap in 2027
Methodology improvements – Crypto’s S-Curve
- One way to more accurately gauge a given cryptoasset’s level of penetration of its TAM is through the “S-curve.” The S-curve is a theory that states that technologies grow and emerge in multiple waves. It was initially proposed by E.M Rogers in 1962 as the Diffusion of Innovation (DOI) Theory to explain how, over time, a new technology gains momentum and spreads through a specific population or social system.
Figure 9: S-curve and the Diffusion of Innovation Theory
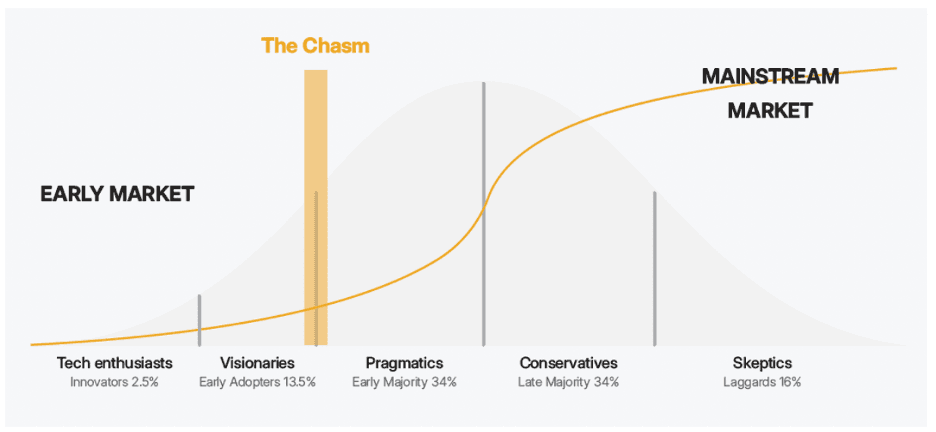
Source: Design by 21Shares
- There were 425 million crypto users globally at the beginning of 2023, representing about 5.31% of the world population.
- The level of crypto adoption today is equivalent to internet adoption in 1999-2000.
Figure 10: S-curve, crypto adoption compared to internet adoption
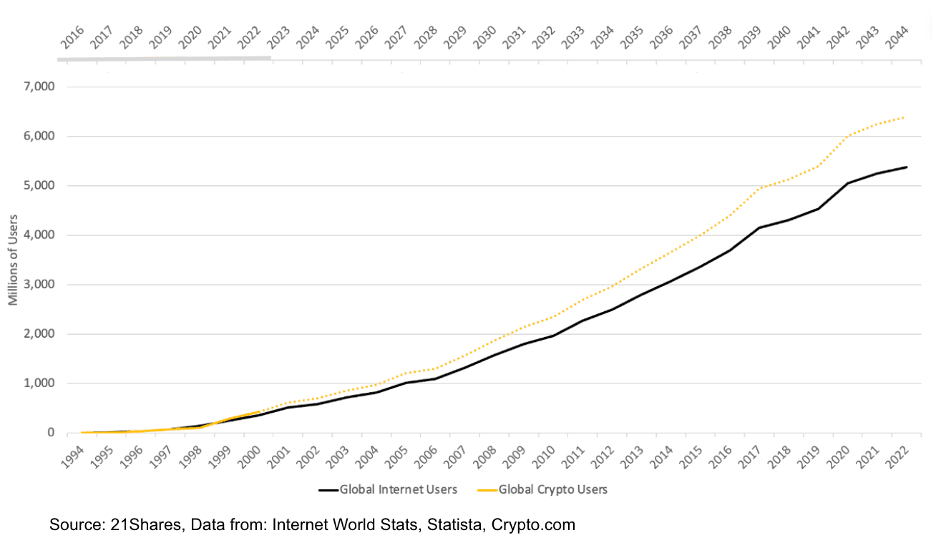
Source: 21Shares, Data from Internet World Stats, Statista, Crypto.com
Portfolio Allocation
Correlation of returns across asset classes
In Figure 11, we compare the correlation of returns for several major asset classes, represented by popular exchange-traded funds (ETFs), as well as Bitcoin (BTC) and Ethereum (ETH). The ETFs chosen represent a variety of asset classes and risk profiles and are as follows:
- US Equity, represented by SPY – The SPDR S&P 500 ETF
- Developed Equity, represented by EFA – The iShares MSCI EAFE ETF
- Emerging Equity, represented by EEM – The iShares MSCI Emerging Markets ETF
- US Bond, represented by AGG – The iShares Core U.S. Aggregate Bond ETF
- US Long Term Treasury, represented by TLT – The iShares 20+ Year Treasury Bond ETF
- Real Estate, VNQ – The Vanguard Real Estate ETF
- Gold, GLD – The SPDR Gold Shares ETF
- ARK Innovation, represented by ARKK
Bitcoin’s correlation with major asset classes ranges from 0.01 to 0.28 (excluding Ethereum), a similar level to what Gold (GLD) offers ranging from 0.07 to 0.24. This level of correlation made both assets a vital diversification source for traditional portfolios, which are a mix of equities and bonds. However, there is almost no correlation (0.11) between Gold and bitcoin, making both unique diversification resources for investors’ portfolios.
Figure 11: Correlation matrix
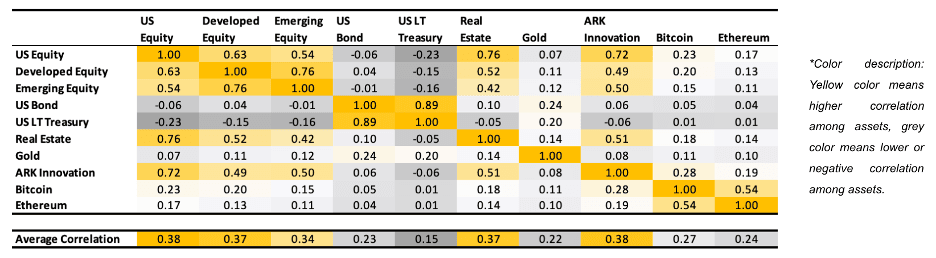
Source: 21Shares. Data: Bloomberg, Yahoo Finance (BTC). From 31/12/2014 to 30/06/2023.
Portfolio with different rebalancing frequencies
5% BTC allocation
We tested six types of rebalancing strategies by adding 5% constant bitcoin allocation to a simple growth portfolio (US Equity – 60%, US Bond – 40%): daily, weekly, monthly, quarterly, annually, and no rebalancing (see next slide). These are the key takeaways:
- Improved risk-adjusted returns: Adding crypto to an investor’s portfolio is noticeable with improved overall performance across all rebalance frequencies, improving annualized return from 6.17% to double digits range (from 10.97% to 27.16%) and enhancing Sharpe ratio from 0.45 to the 1.02 level.
- Rebalancing is key: However, adding Bitcoin without rebalancing, overall risks suffers with 48.70% annualized volatility, almost four times higher than the benchmark of 13.61%. The most efficient rebalancing schedule is annual. This strategy has historically proven to be maximizing cumulative returns (313%) and the Sharpe (1.02) and Sortino (1.62) ratios.
- Timing doesn’t really matter: As investors argue that timing matters in crypto investments, the research showed regardless of when to add bitcoin to their portfolio, 80% of the time, the strategy outperformed the benchmark in the next 1 year, and 100% of the time, the strategy exceeded it in the next 3 years.
Figure 12: Portfolio with different rebalancing frequencies (5% BTC allocation)

Source: 21Shares, Bloomberg, CoinGecko
1% BTC allocation
We also tested six types of rebalancing strategies by adding just 1% constant bitcoin allocation to a simple growth portfolio (US Equity – 60%, US Bond – 40%): daily, weekly, monthly, quarterly, annually, and no rebalancing (see next slide). These are the key takeaways:
- Improved risk-adjusted returns: Adding crypto to an investor’s portfolio is noticeable with improved overall performance across all rebalance frequencies, improving annualized return and enhancing Sharpe ratio from 0.45 to the 0.63 level.
- Rebalancing is key: Adding just 1% constant bitcoin allocation also reduced annualized volatility across all rebalance frequencies, except no rebalancing, in which case overall risk suffers with 25.47% annualized volatility.
- Timing doesn’t really matter: As investors argue that timing matters in crypto investments, the research showed regardless of when to add bitcoin to their portfolio, 80% of the time, the strategy outperformed the benchmark in the next 1 year, and 100% of the time, the strategy exceeded it in the next 3 years.
Figure 13: Portfolio with different rebalancing frequencies (1% BTC allocation)
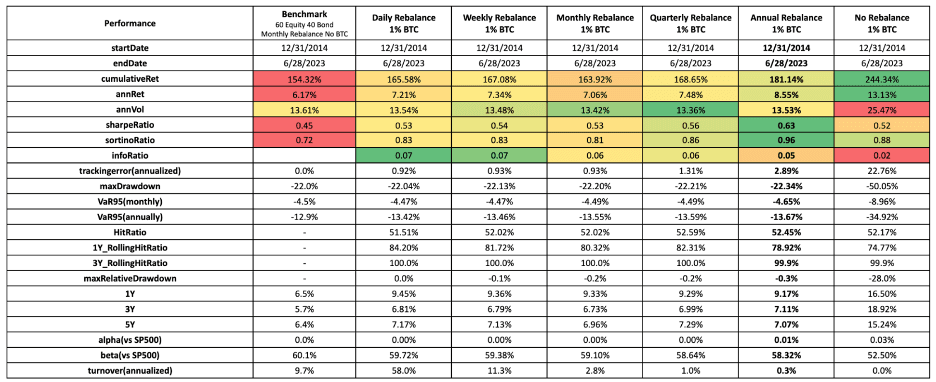
Source: 21Shares, Bloomberg, CoinGecko
Conclusion
- Bitcoin valuation: We estimate the floor price of Bitcoin using the Mining Production Cost. In addition, we use relative valuation approaches like market sizing and multiples to value the asset (see Figure 14)
- Ethereum valuation: We value Ethereum using an intrinsic valuation, computed with a discounted cash flow (DCF) method.
- Challenges relative to cryptoasset valuations: We aim to provide investors with the right tools to value this asset class as there is no objective measure of value for cryptoassets today. However, it is worth remembering that the more uncomfortable an investor feels when valuing an asset, the greater the payoff of doing the valuation.
- Portfolio allocation: Adding Bitcoin to an investor’s portfolio may provide diversification benefits due to its low historical correlation to other asset classes. In our backtesting, it also improved overall performance across all rebalance frequencies, improving annualized returns and enhancing the Sharpe ratio.
Figure 14: Summary of valuation price ranges

Source: 21Shares
Disclaimer
This document is not an offer to sell or a solicitation of an offer to buy or subscribe for securities of 21Shares AG. Neither this document nor anything contained herein shall form the basis of, or be relied upon in connection with, any offer or commitment whatsoever in any jurisdiction. This document and the information contained herein are not for distribution in or into (directly or indirectly) the United States, Canada, Australia or Japan or any other jurisdiction in which the distribution or release would be unlawful.This document does not constitute an offer of securities for sale in or into the United States, Canada, Australia or Japan. The securities of 21Shares AG to which these materials relate have not been and will not be registered under the United States Securities Act of 1933, as amended (the “Securities Act”), and may not be offered or sold in the United States absent registration or an applicable exemption from, or in a transaction not subject to, the registration requirements of the Securities Act. There will not be a public offering of securities in the United States.This document is only being distributed to and is only directed at: (i) to investment professionals falling within Article 19(5) of the Financial Services and Markets Act 2000 (“FSMA”) (Financial Promotion) Order 2005 (the “Order”); or (ii) high net worth entities, and other persons to whom it may lawfully be communicated, falling within Article 49(2)(a) to (d) of the Order (all such persons together being referred to as “relevant persons”); or (iii) any other persons to whom this document can be lawfully distributed in circumstances where section 21(1) of the FSMA does not apply. The securities are only available to, and any invitation, offer or agreement to subscribe, purchase or otherwise acquire such securities will be engaged in only with, relevant persons. Any person who is not a relevant person should not act or rely on this document or any of its contents.In any EEA Member State (other than the Austria, Belgium, Croatia, Denmark, Finland, France, Germany, Great Britain, Hungary, Ireland, Italy, Liechtenstein, Luxembourg, Malta, The Netherlands, Norway, Poland, Romania, Slovakia, Spain and Sweden) that has implemented the Prospectus Regulation (EU) 2017/1129, together with any applicable implementing measures in any Member State, the “Prospectus Regulation”) this communication is only addressed to and is only directed at qualified investors in that Member State within the meaning of the Prospectus Regulation.Exclusively for potential investors in Austria, Belgium, Croatia, Denmark, Finland, France, Germany, Great Britain, Hungary, Ireland, Italy, Liechtenstein, Luxembourg, Malta, The Netherlands, Norway, Poland, Romania, Slovakia, Spain and Sweden the 2021 Base Prospectus (EU) is made available on the Issuer’s website under www.21Shares.com.The approval of the 2021 Base Prospectus (EU) should not be understood as an endorsement by the SFSA of the securities offered or admitted to trading on a regulated market. Eligible potential investors should read the 2021 Base Prospectus (EU) and the relevant Final Terms before making an investment decision in order to understand the potential risks associated with the decision to invest in the securities. You are about to purchase a product that is not simple and may be difficult to understand.This document constitutes advertisement within the meaning of the Swiss Financial Services Act (the “FinSA”) and not a prospectus. In accordance with article 109 of the Swiss Financial Services Ordinance, the Base Prospectus dated 12 November 2021, as supplemented from time to time and the final terms for any product issued have been prepared in compliance with articles 652a and 1156 of the Swiss Code of Obligations, as such articles were in effect immediately prior to the entry into effect of the FinSA, and the Listing Rules of the SIX Swiss Exchange in their version in force as of January 1, 2020. Consequently, the Prospectus has not been and will not be reviewed or approved by a Swiss review body pursuant to article 51 of the FinSA, and does not comply with the disclosure requirements applicable to a prospectus approved by such a review body under the FinSA.